Business Challenge:

One of the largest retail and distribution giants in the GCC needed to develop a dashboard for evaluating the sales performance of various stores under the group. The client also sought a proper benchmark to assess the sales performance of their brand-new store. The client was utilizing an Excel-based heuristic process to measure sales performance, resulting in inefficient data mining and poor organizational visibility in each store. This made it challenging for them to identify top/underperforming areas and the underlying causes.

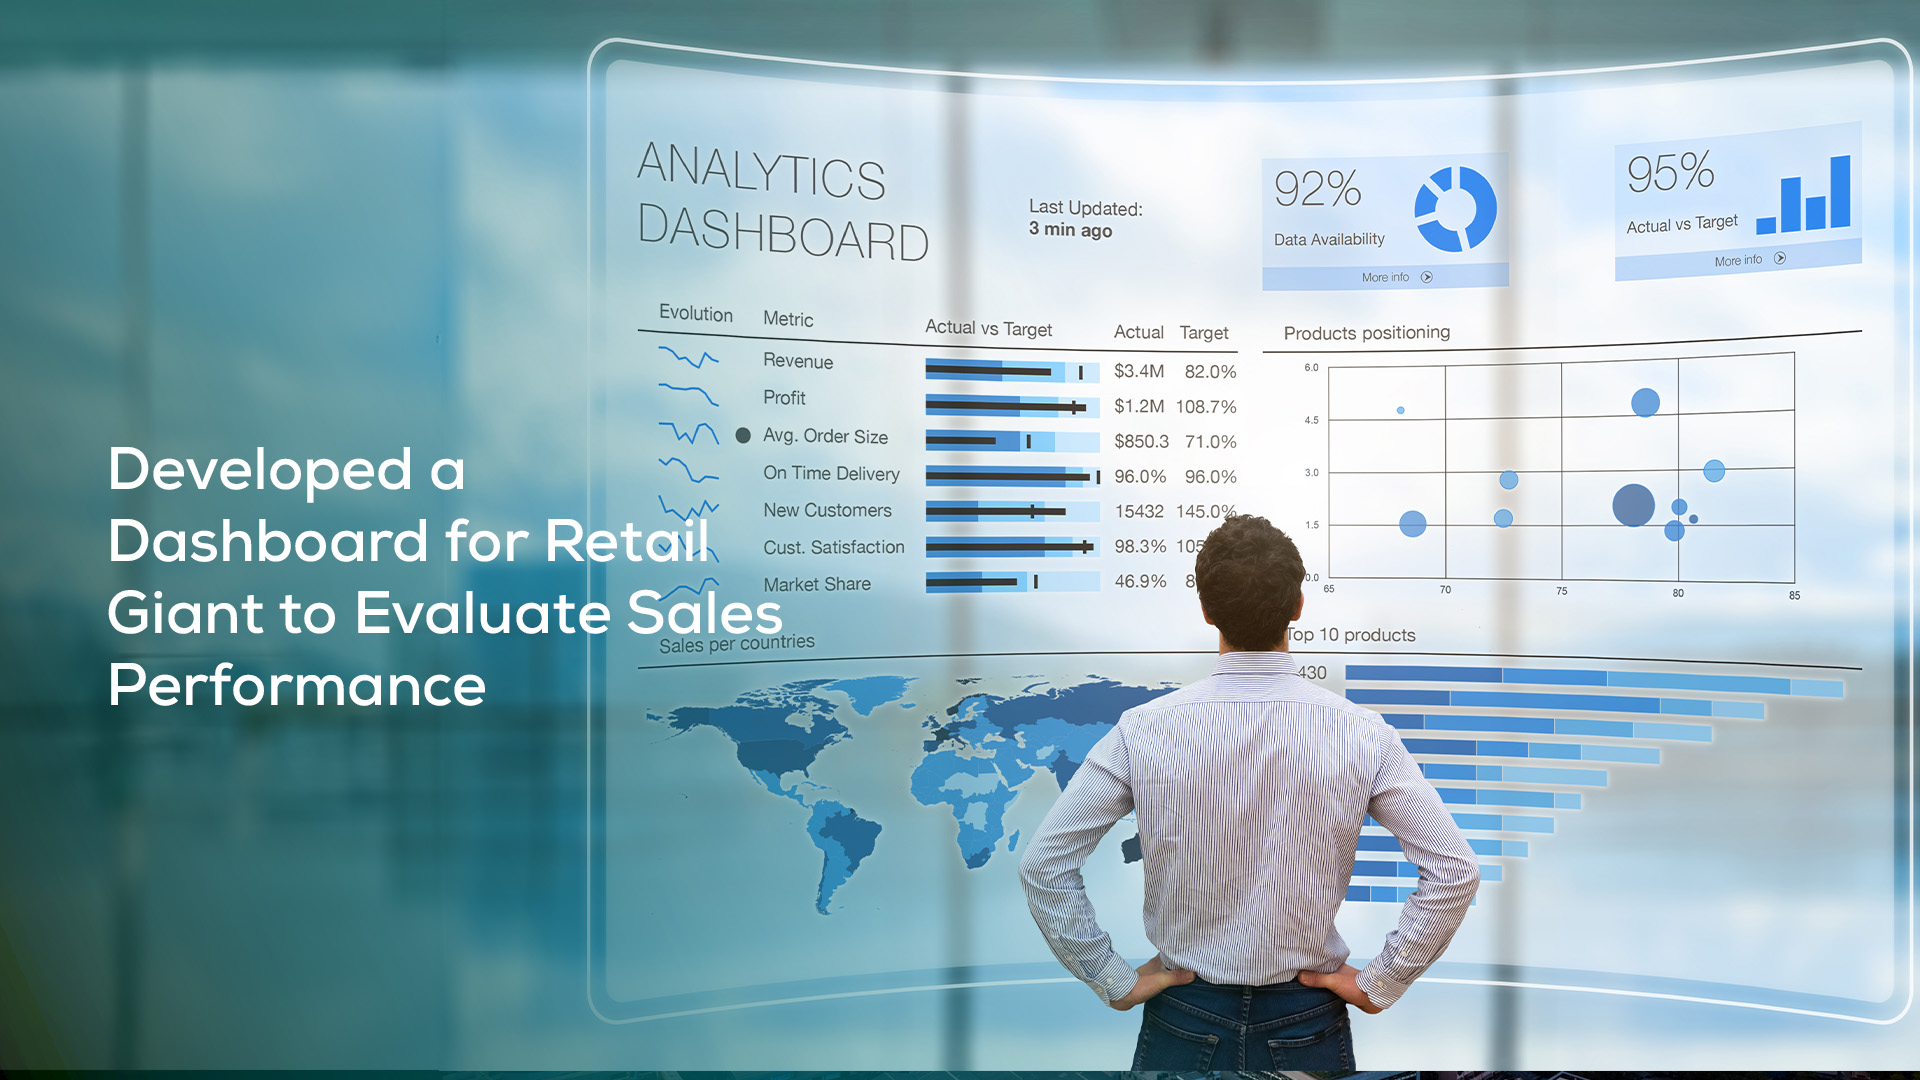
We collaborated with the client to develop an automated and comprehensive BI dashboard, depicting all key metrics to evaluate sales performance from organizational to category-brand level, in both existing and new stores. This would make it easier for the client to highlight top/underperforming areas and deep dive into those areas to decode the underlying causes.

TurnB Approach:
  • Identified data sources for analysis.
  • Checked for missing values, data discrepancies, and outliers. Extracted, treated, and maintained data to ensure the accuracy and performance of the dashboard.
  • For existing stores, the previous year's sales were set as the criteria for evaluating current year sales.
  • For the brand-new store, month-over-month sales changes of their existing stores were taken into consideration. This logical benchmarking indicated current market patterns, considering the client is a major player in the retail sector.
  • Identified and formulated key metrics and KPIs for sales comparison, incorporating metrics in the dashboard that could be sliced and diced with ease from organizational to category-brand level.
  • Designed the dashboard and arranged metrics in an intuitive manner to identify top/underperforming areas and comprehend the impact.
  • Implemented key features of Power BI like 'Live connection to existing reports, Direct Query, Cross-report drill-through, etc. This minimized data load and improved the overall efficiency and performance of the dashboard.
Implications:
  • Replaced old standalone manual reporting with a readily available, automated BI dashboard, resulting in the following outcomes:
  • This end-to-end automation allowed the client to set up a daily sales monitoring process.
  • Enabled smoother reporting, improved data integrity, and a reduction in manual labor/cost.
  • Helped the client to compare and evaluate the sales performance of their brand-new store based on the set benchmark.
  • Easily identified focus areas to target based on growth/degrowth.
  • Performed a root cause analysis on focus areas by correlating and analyzing the key sales-driving factors.
  • Enabled the client to take proactive measures by pulling the right levers for maximizing sales and margin.